Main Menu
Our hotspots are the best place to start for an investor that is unsure where they want to invest or If you are looking for averages in any UK area. Using this tool, you can find the highest yield or growth areas throughout the UK and use these hotspots to narrow down your search criteria and find deals. You can also compare UK average sales and rent prices by property type or the number of bedrooms.
Find out what areas have the maximum price growth throughout the UK and check and compare house price trends to see what property prices have appreciated the most.
Use our heatmaps to identify high yielding property hotspots throughout the UK and find the best performing rental properties. Use the hotspots to narrow your search criteria and find deals using Deal Finder.
Use our heatmaps to check asking prices by property type or by the number of bedrooms for properties in towns within the UK.
Use our heatmaps to find out what the asking rents are by property type or by the number of bedrooms in towns within the UK.
Find out what areas have the maximum price growth throughout the UK and check and compare house price trends to see what property prices have appreciated the most.
You need to have signed up to our platform to access this part of the tool. Sign up here.
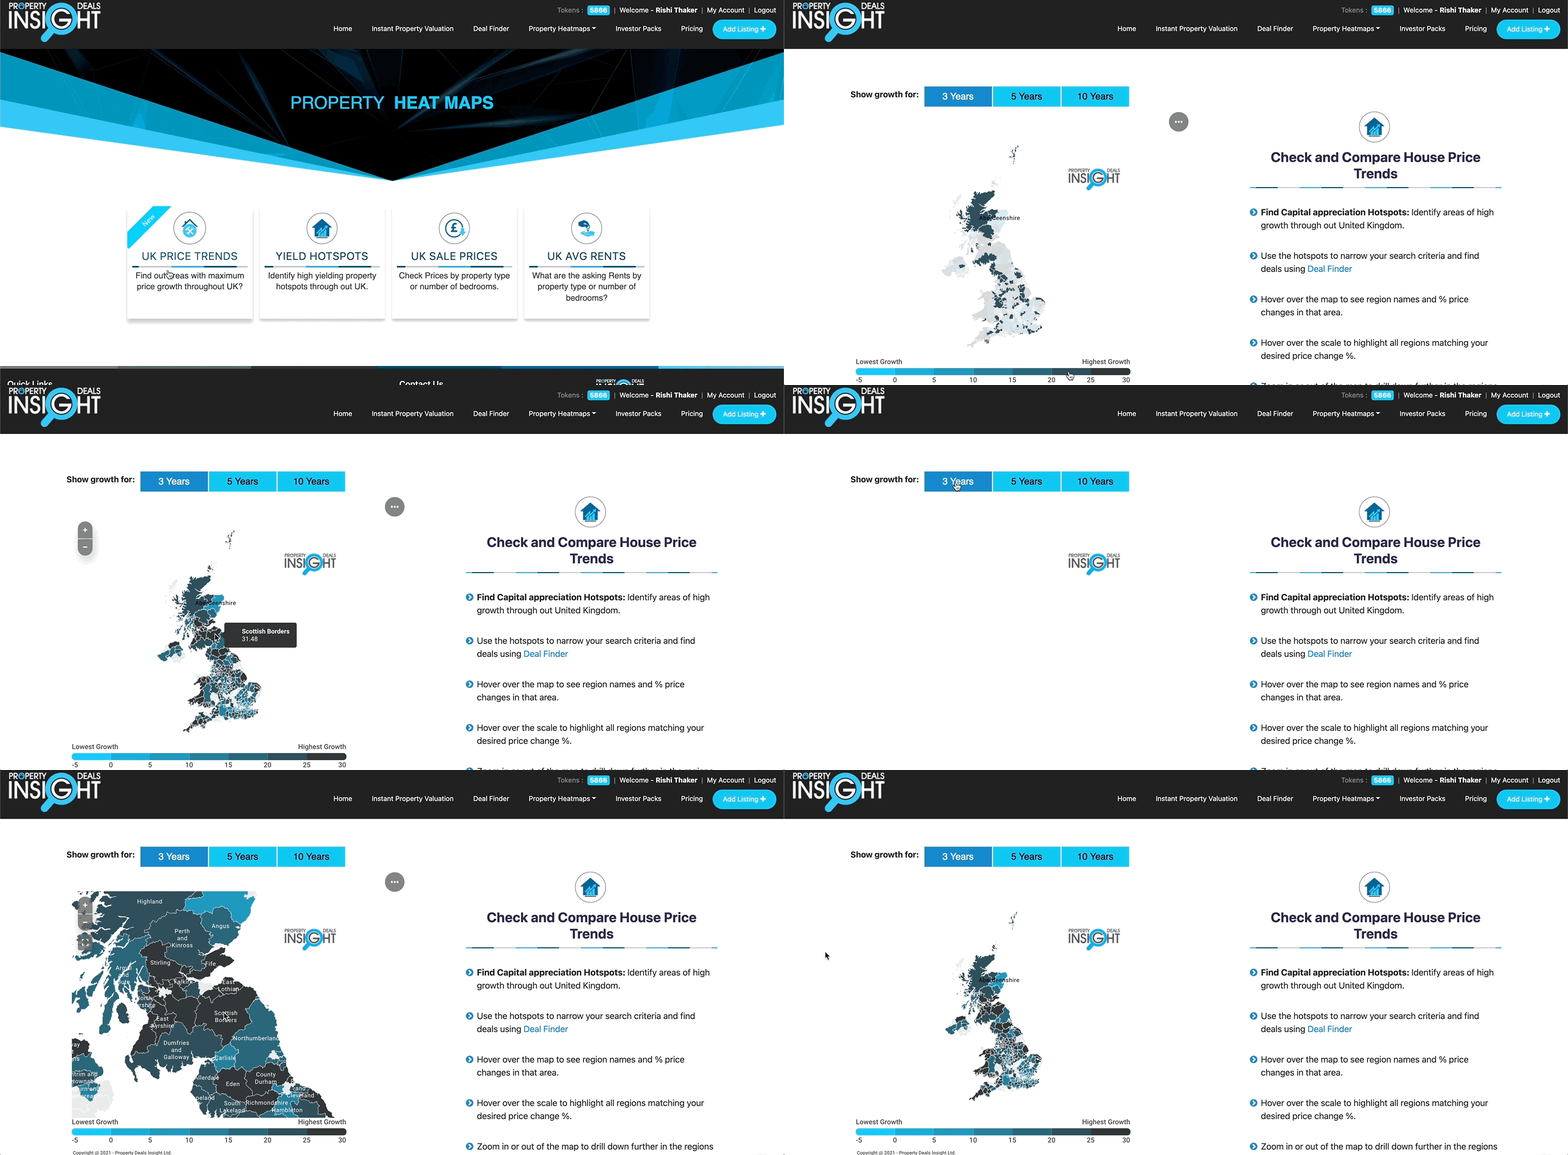
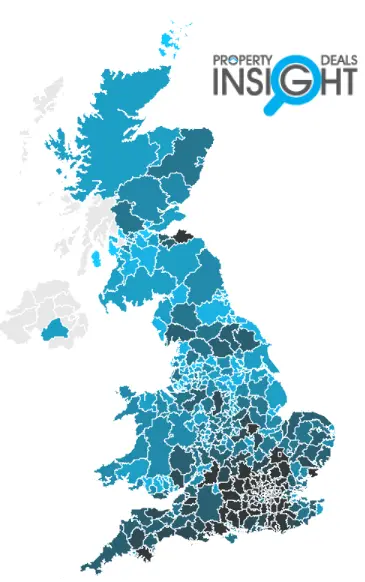
Use our heatmaps to find capital appreciation hotspots of high growth throughout the UK. You can see growth for 3, 5 and 10 years. Hover over the scale to highlight all regions matching your desired price change percentage and hover over the map to see region names and percentage price changes in that area. You can also zoom into the heatmap if you want to find a specific region’s growth.
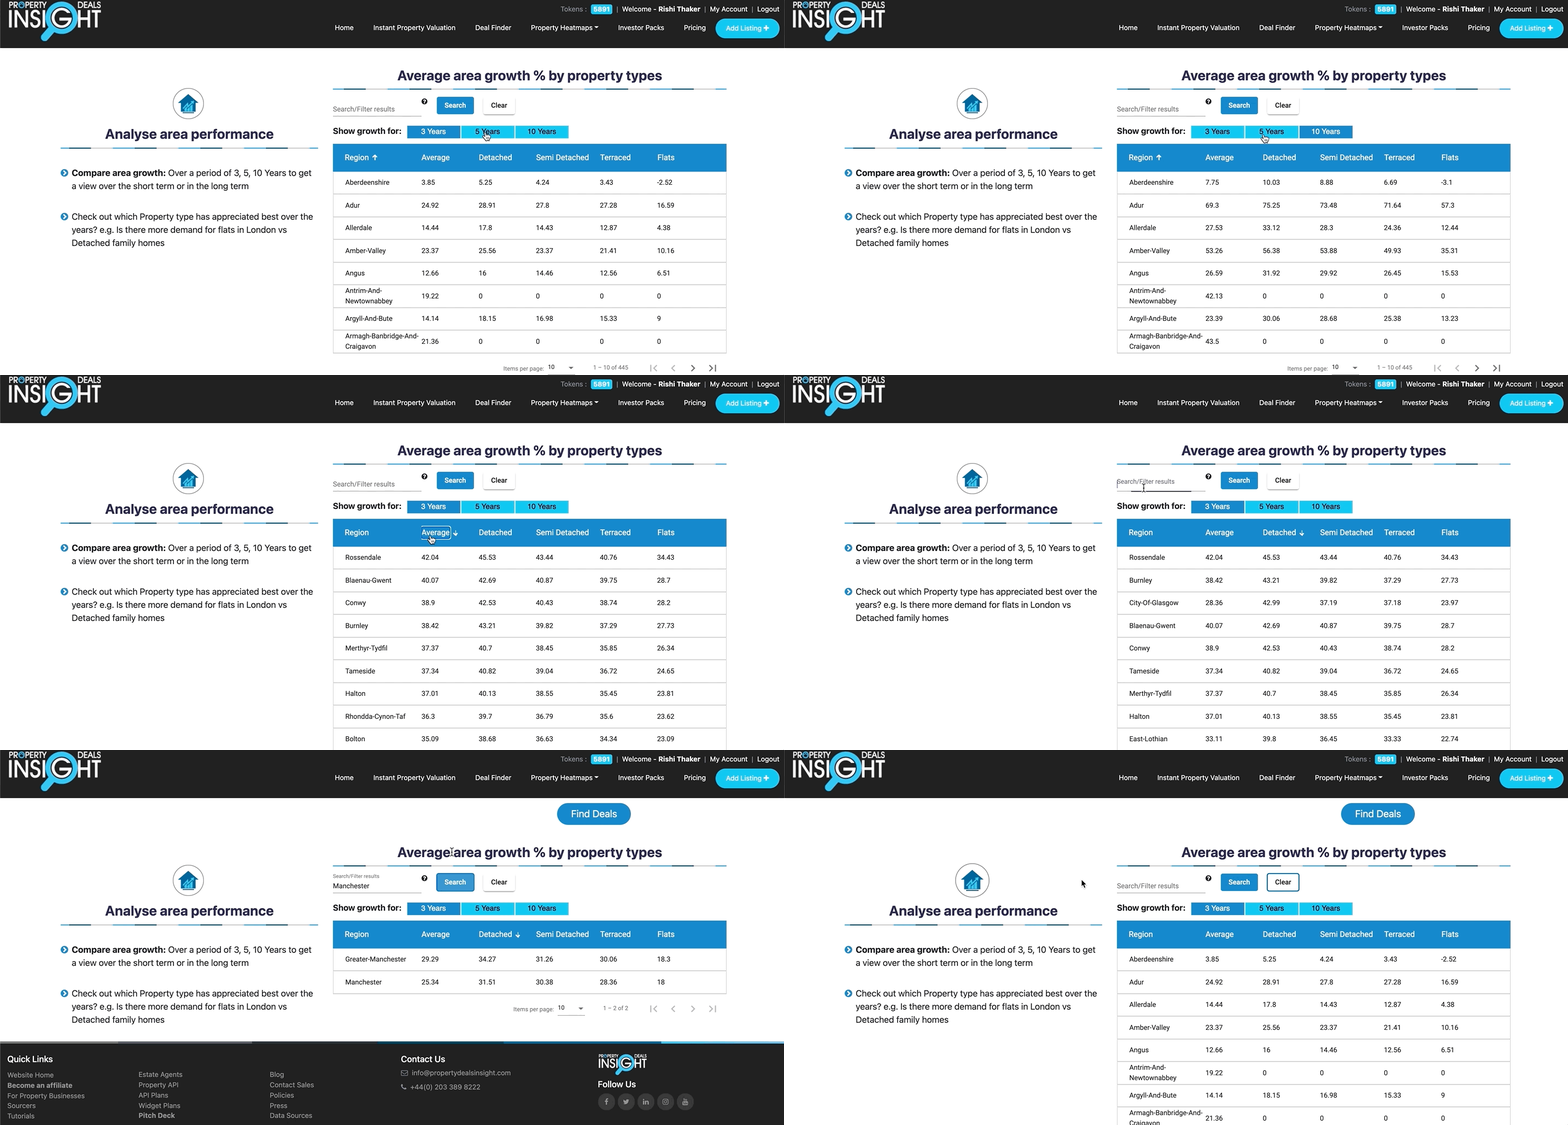
Use our tables to analyse area performance and average area growth percentage by property types. Compare area growth over a 3, 5 and 10 year period to get a view of the short and long term.
Here we can find out what property type has appreciated the best over the years for a specific town. You can search for a specific town and can filter your search to see the best/worst region and property type growth by clicking the headings.
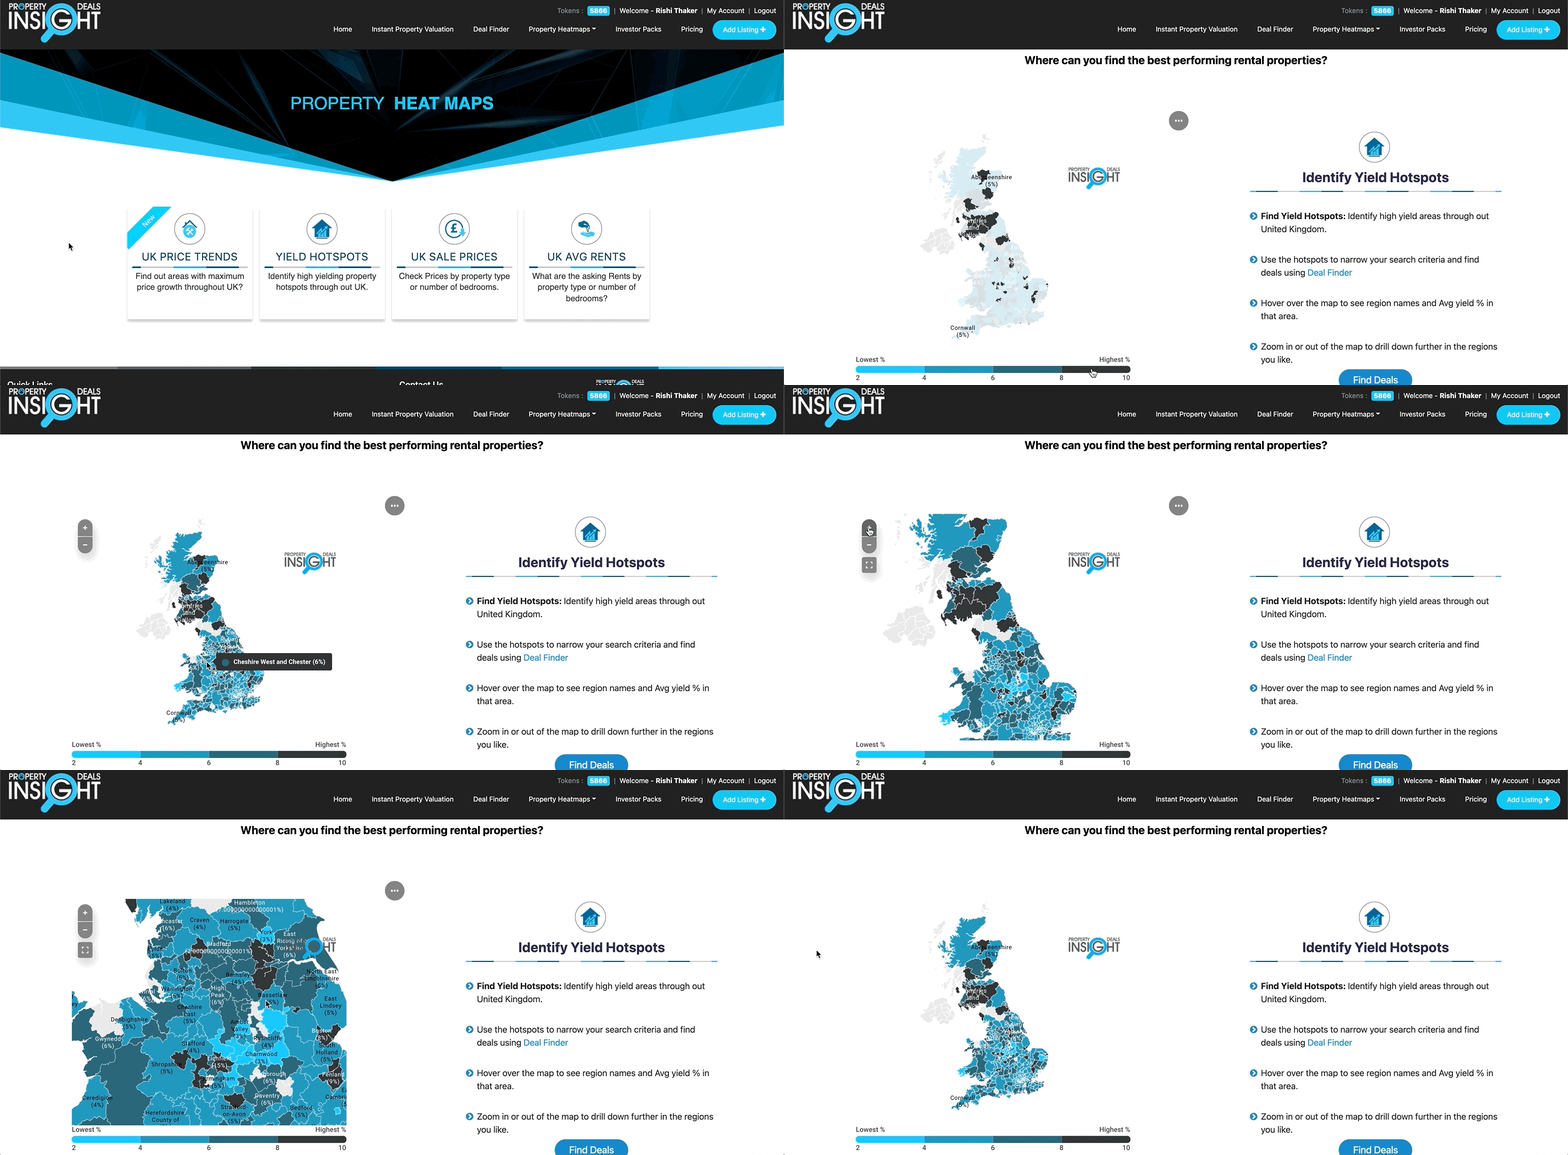
Hover over the scale to highlight all regions matching your desired price change percentage and hover over the map to see region names and the average yield percentage in that area. You can also zoom into the heatmap if you want to find a specific region’s yield.
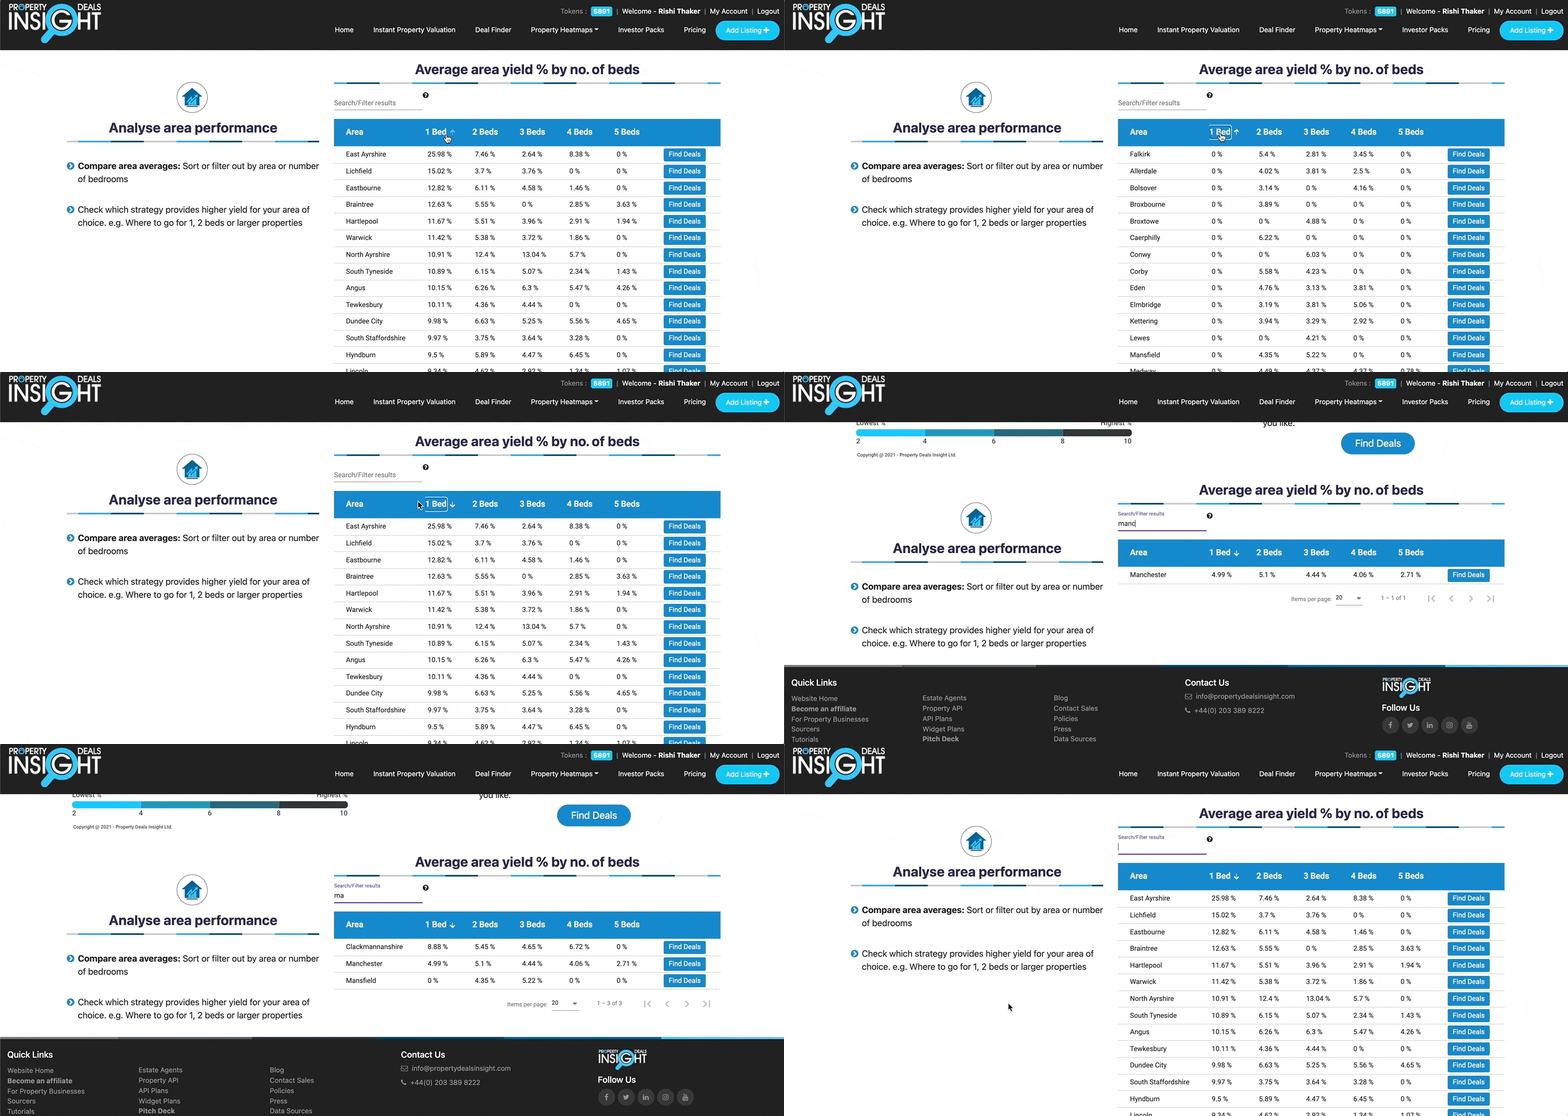
Use our tables to analyse area performance and compare area averages by the number of bedrooms. Check which strategy provides a higher yield for your area of choice. You can search for a specific town and can filter your search to see the best/worst yield percentage per number of beds by clicking the headings.
Use our heatmaps to check asking prices by property type or by the number of bedrooms for properties in towns within the UK.
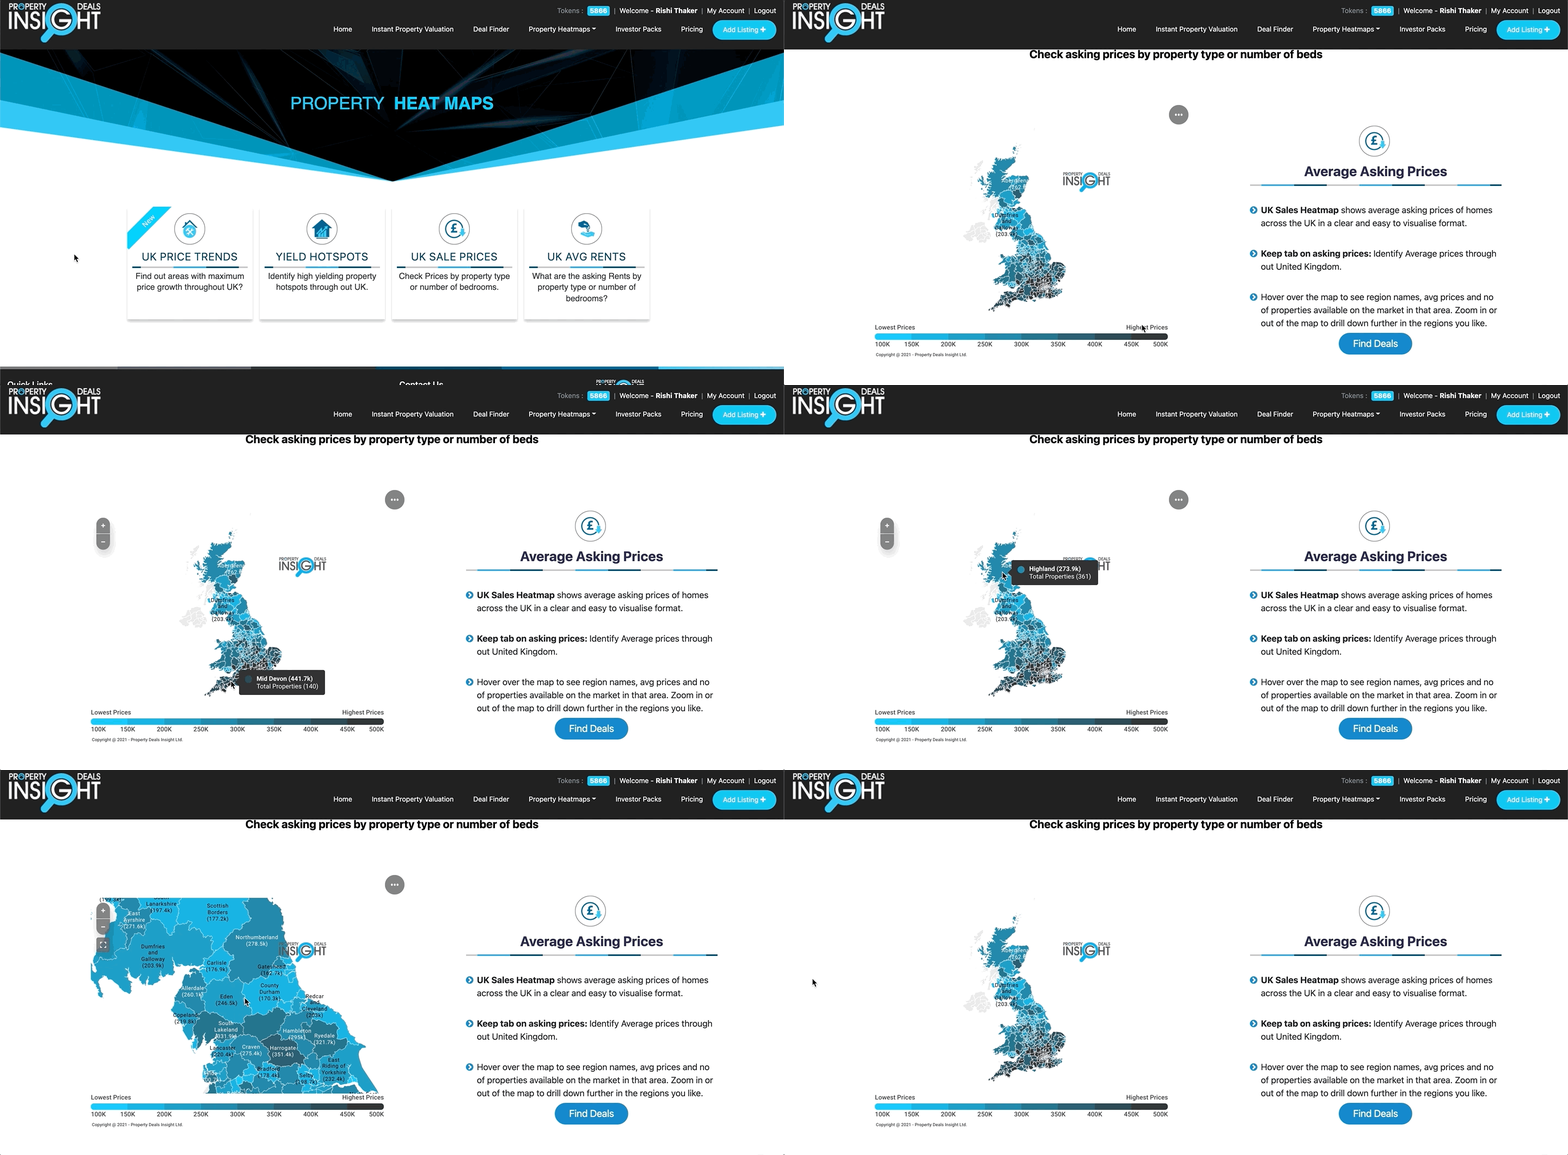
This sales heatmap will show the average asking prices of homes across the UK in a clear and easy to visualise format. Hover over the scale to highlight all regions matching your desired sale price and hover over the map to see region names, the average asking price and the number of properties available on the market in that region. You can also zoom into the heatmap if you want to find a specific region’s average asking price.
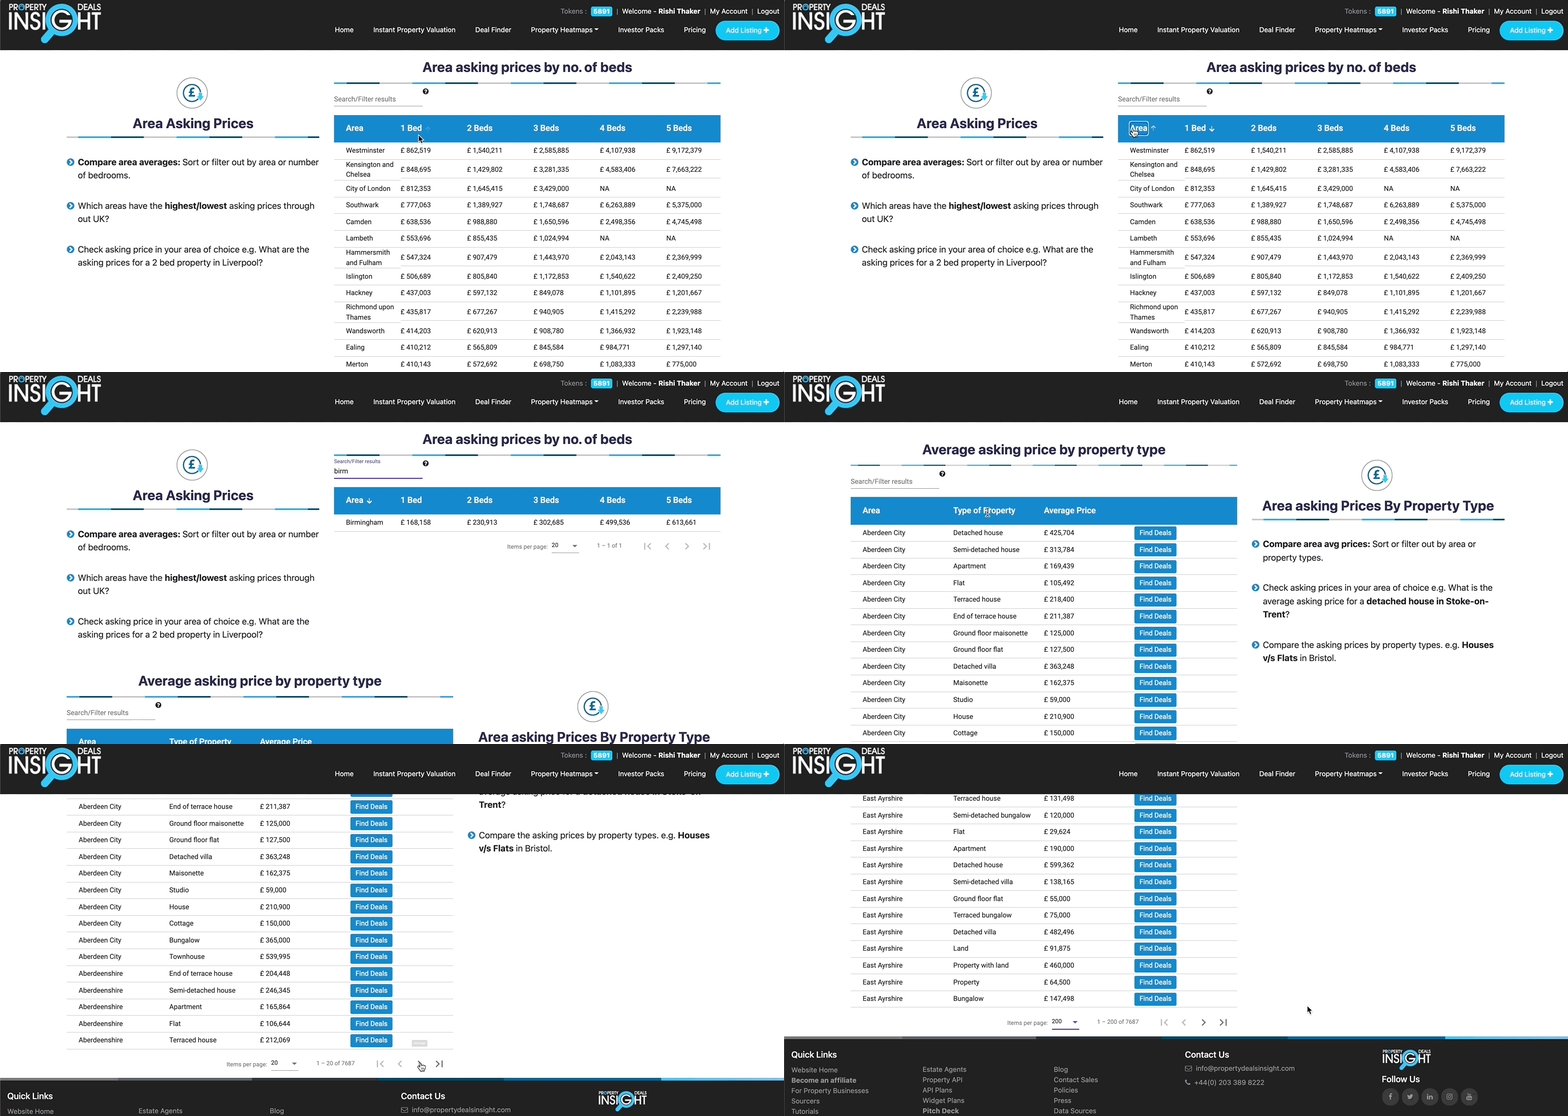
Use our tables to analyse area performance and compare asking prices of areas by property type or the number of bedrooms.
Compare area averages and use the search bar to check the asking price in the area of your choice. You can also filter your search to see which areas have the highest/lowest asking prices throughout the UK for each number of bedrooms and for different types of property.
Use our heatmaps to find out what the asking rents are by property type or by the number of bedrooms in towns within the UK.
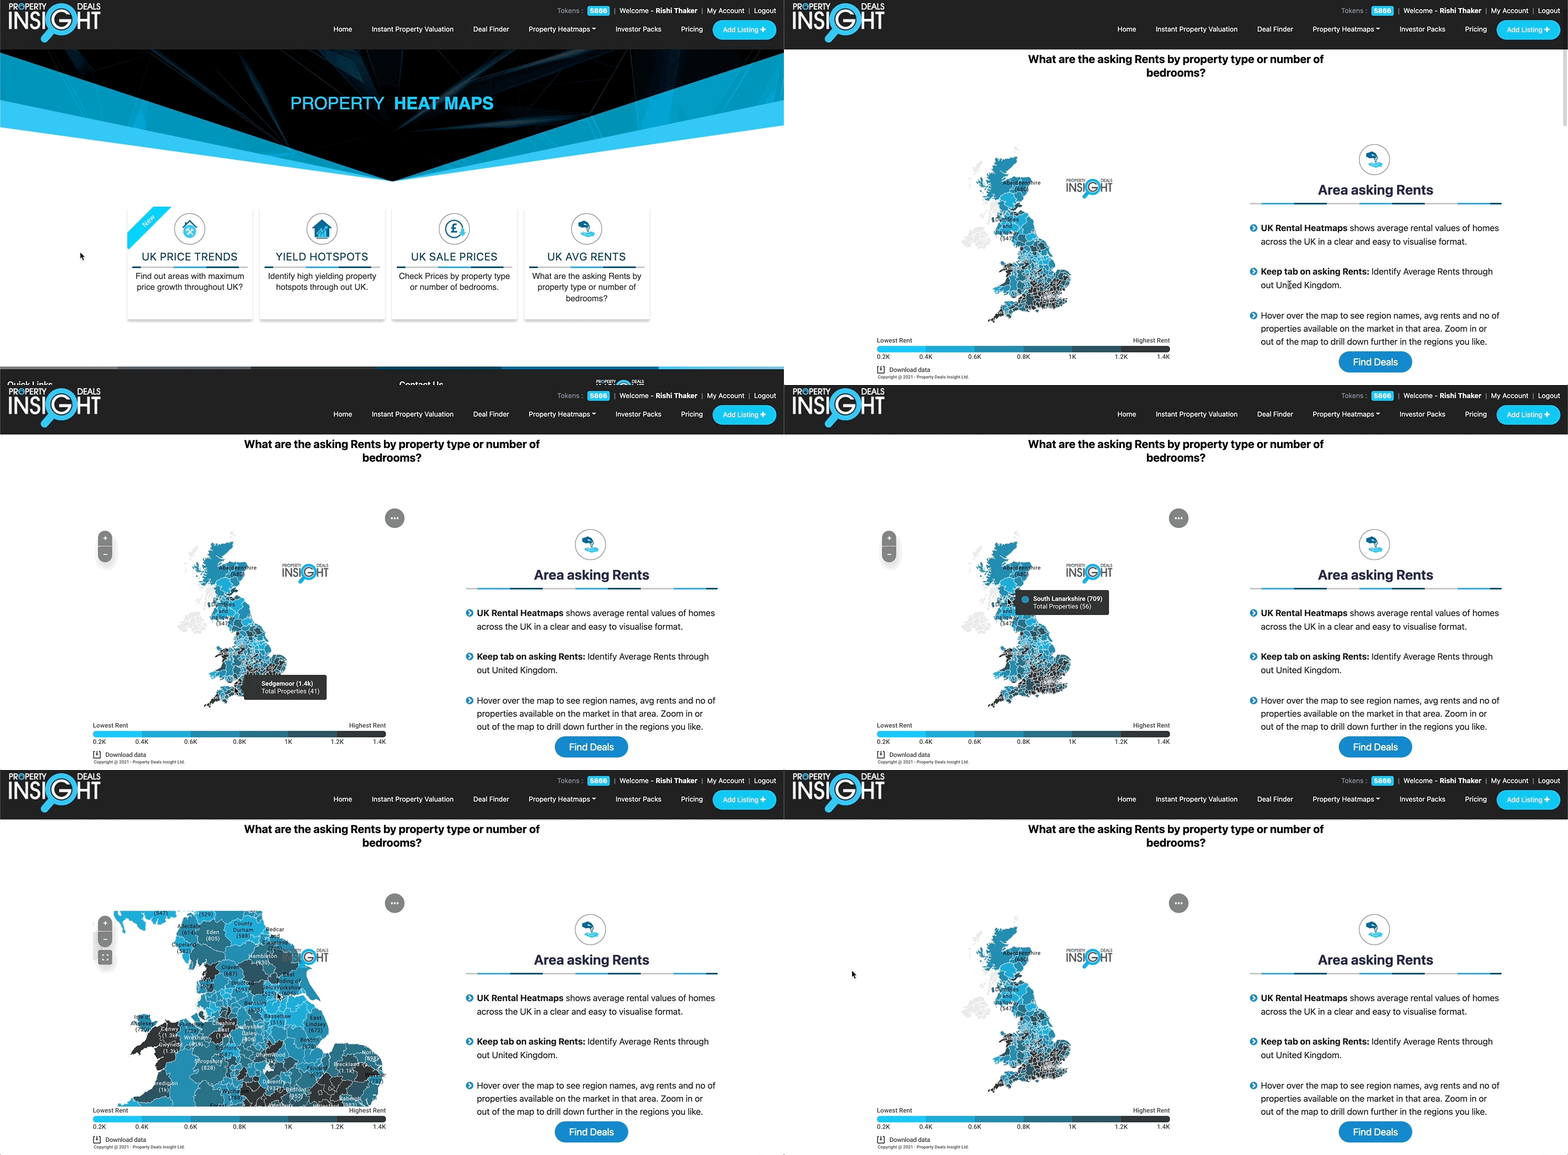
This rental heatmap will show the average rent of homes across the UK in a clear and easy to visualise format. Hover over the scale to highlight all regions matching your desired rent price and hover over the map to see region names, the average rent price and the number of properties available on the market in that region. You can also zoom into the heatmap if you want to find a specific region’s average rent.
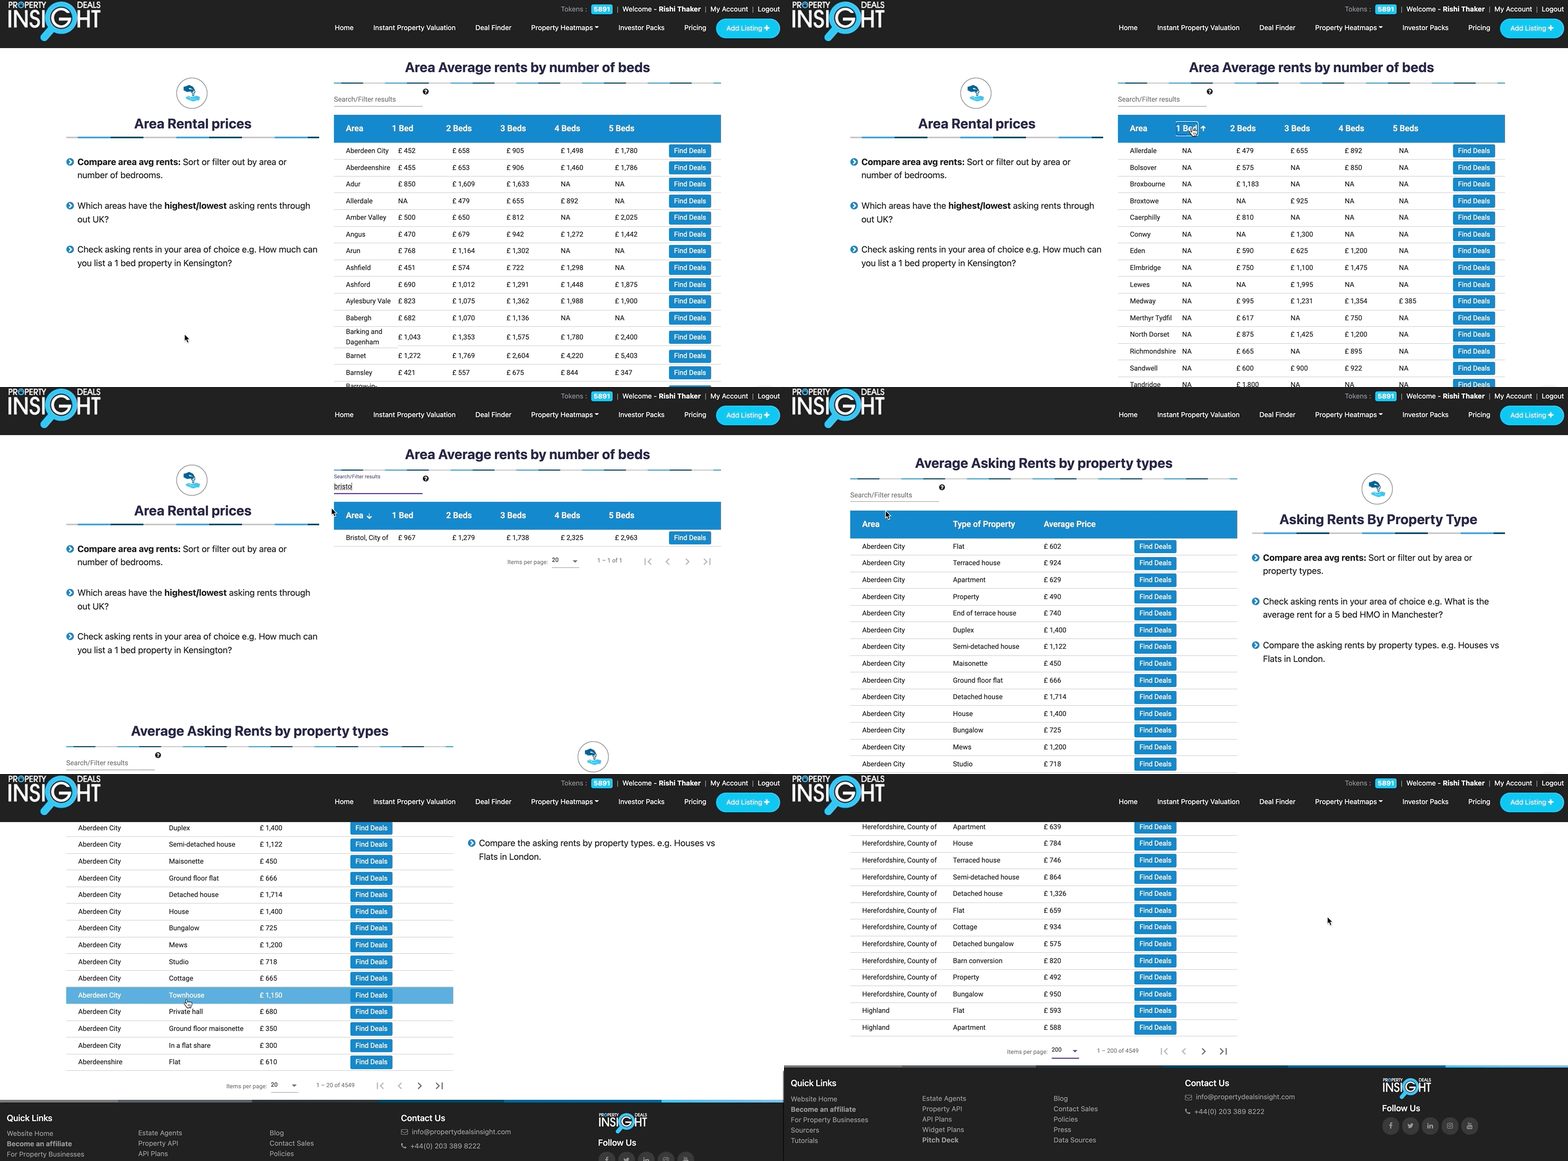
Use our tables to analyse area rental prices and compare area average rent prices by property type or the number of bedrooms.
Compare area averages and use the search bar to check the average rent in the area of your choice. You can also filter your search to see which areas have the highest/lowest rent prices throughout the UK for each number of bedrooms and for different types of property.
