Main Menu
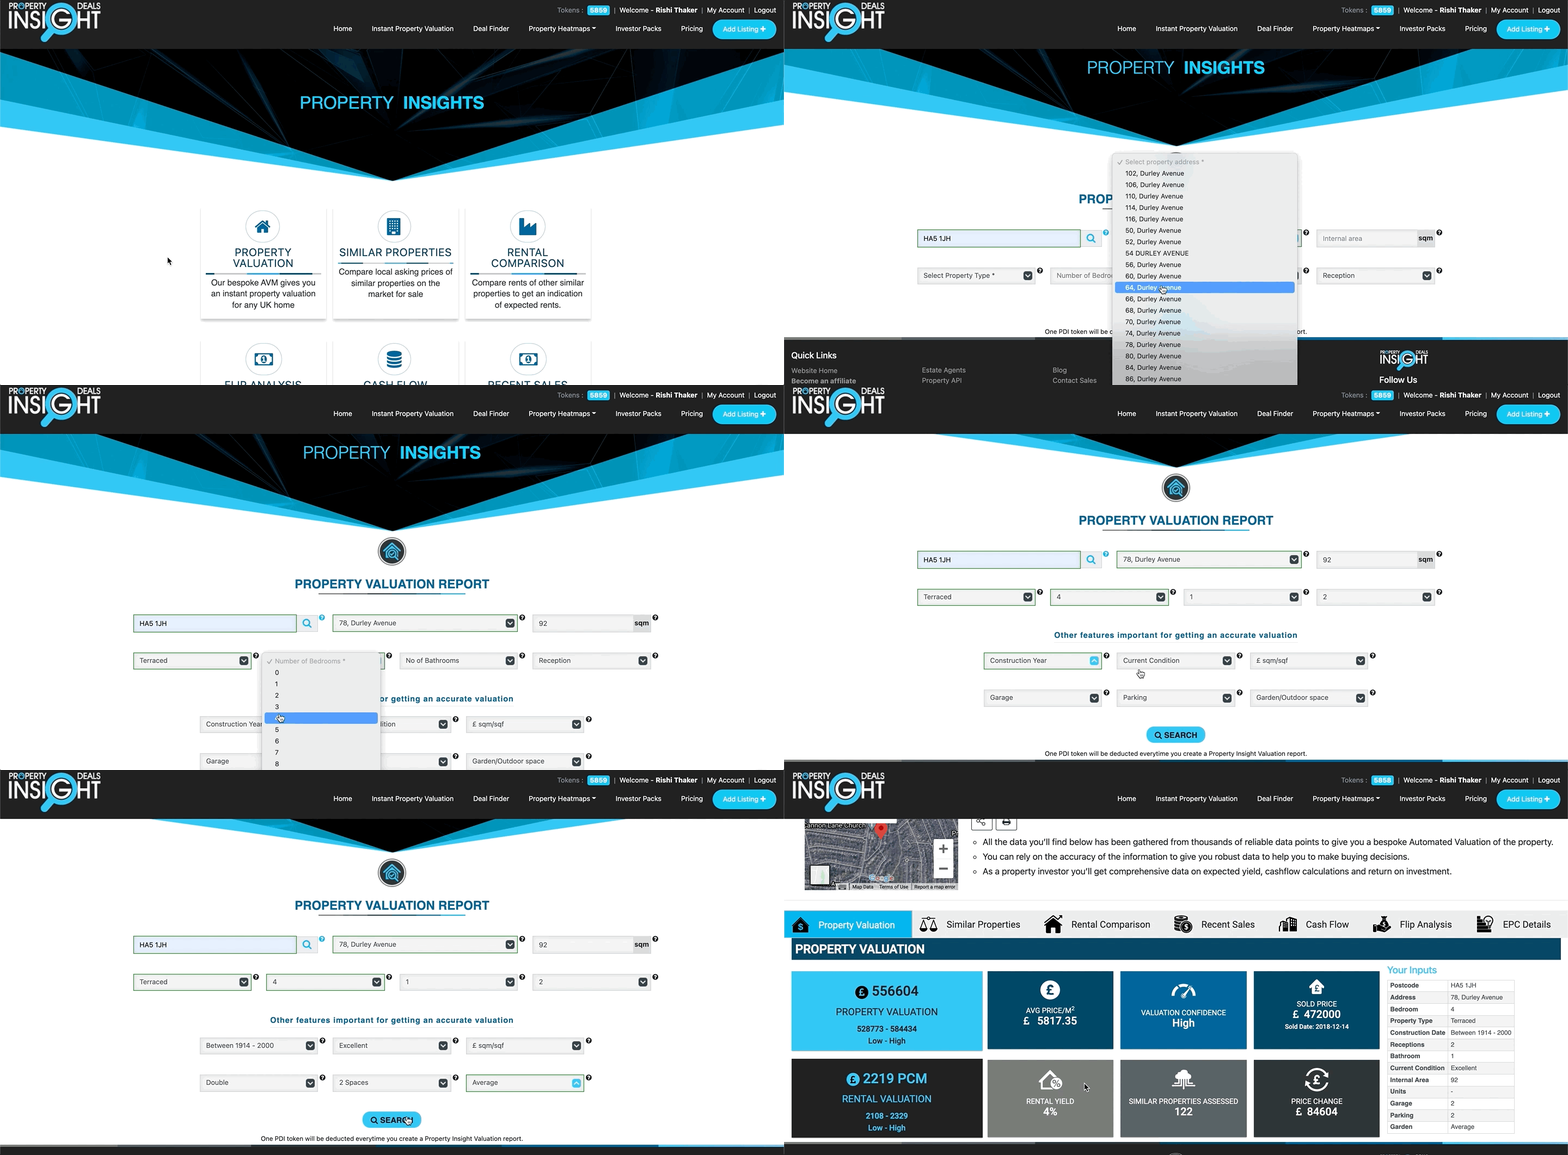
When using this tool, you must have the postcode and address of the property we want insights from readily available. You will then have to fill in some parameters for your report including the number of beds, receptions and bathrooms there are within this property. Our bespoke AVM will provide the internal square metre for you. For a better valuation, we will also ask for some further parameters including the number of garages and parking spaces as well as how big the garden is. The more parameters you fill in, the more accurate a valuation you will get. It is imperative you put in the correct parameters in order to get an accurate valuation.

Have the address of the property you want insights from readily available. It is imperative you fill in all the parameters and ensure it is correct for an accurate valuation. Our bespoke AVM will give you an instant valuation for your property, along with 6 sub-headings worth of data.
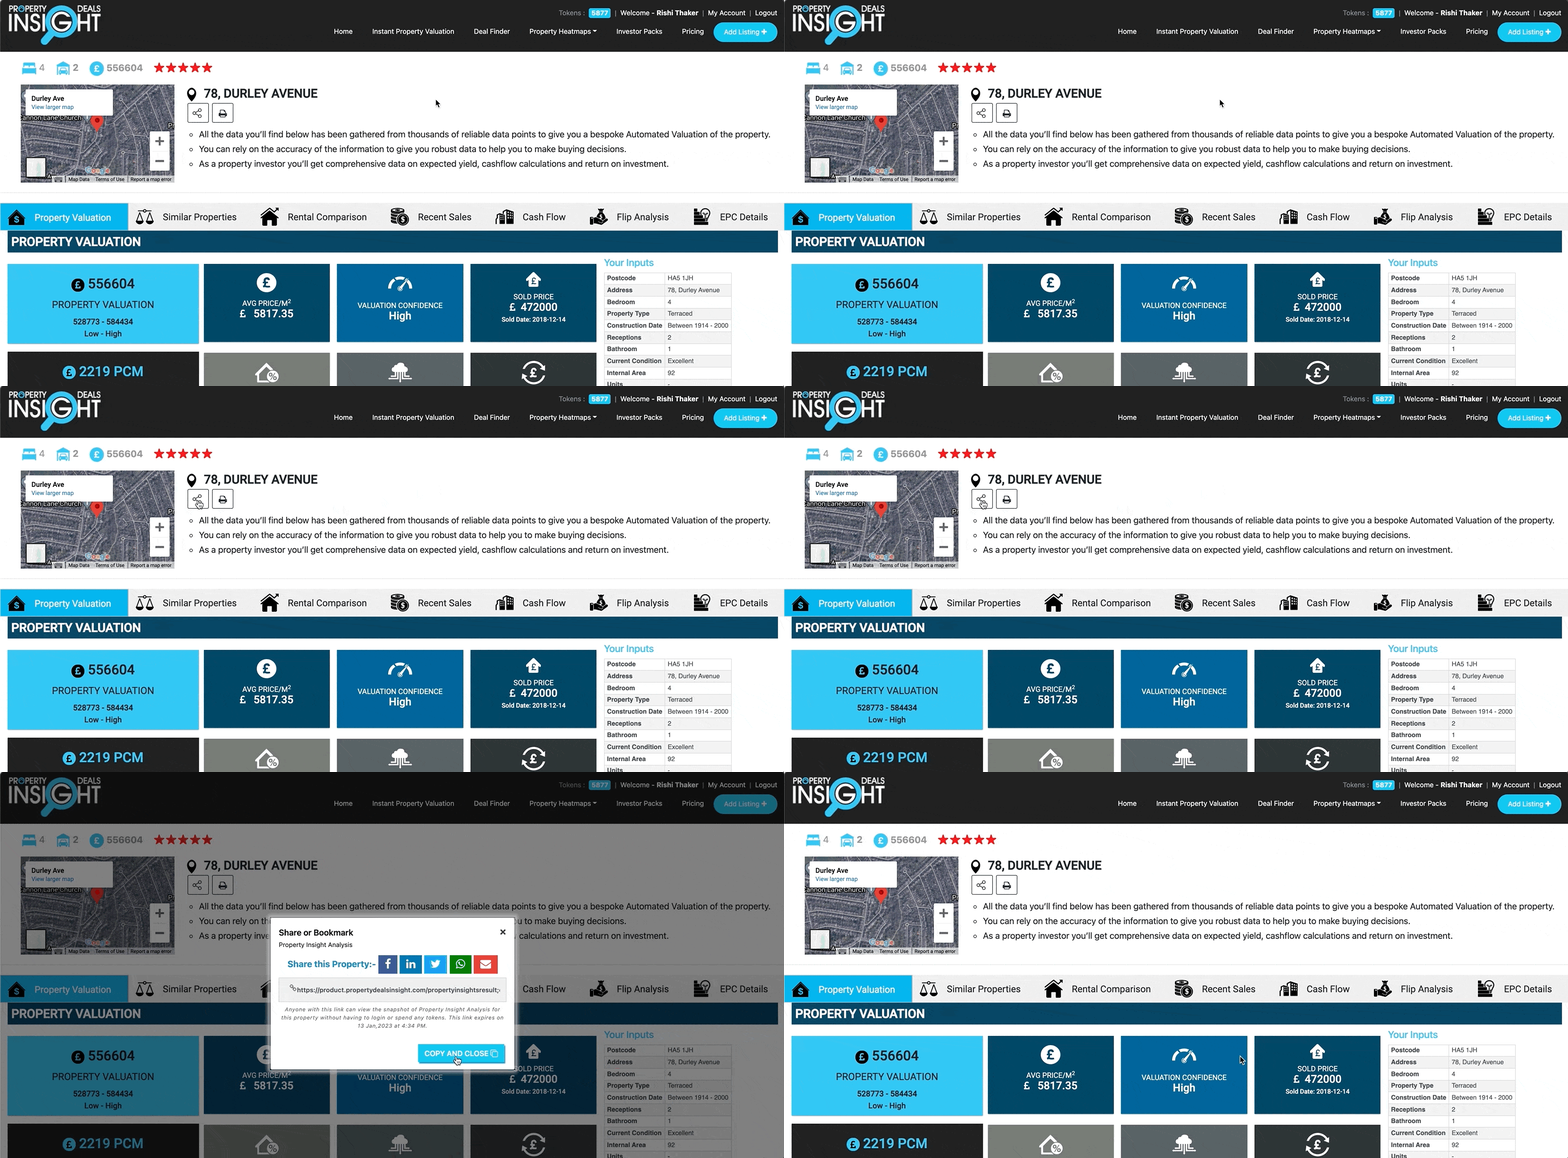
Within your report, you have the option to share your insights with anyone you like by pressing the share button and copying the link. They won’t have to have an account with us in order to open the shared link and see the report.
You also have the option to download your insights into a PDF report. This comes in a professional PDF that you can download onto your desktop and show your clients or partners.
When using this tool, you must have the postcode and address of the property we want insights from readily available. You will then have to fill in some parameters for your report including the number of beds, receptions and bathrooms there are within this property. Our bespoke AVM will provide the internal square metre for you. For a better valuation, we will also ask for some further parameters including the number of garages and parking spaces as well as how big the garden is. The more parameters you fill in, the more accurate a valuation you will get. It is imperative you put in the correct parameters in order to get an accurate valuation.

Our bespoke Auto Valuation Model (AVM) will give you an instant valuation for your property. It will show you the valuation of the property, the average price per metre squared, the valuation confidence, the last sold price, the rental valuation per calendar month, the rental yield, similar properties assessed and the price change.
We also show you the inputs of your parameters.
One PDI token will be deducted for each Property Valuation search. Click here for our pricing page.
Similar Properties
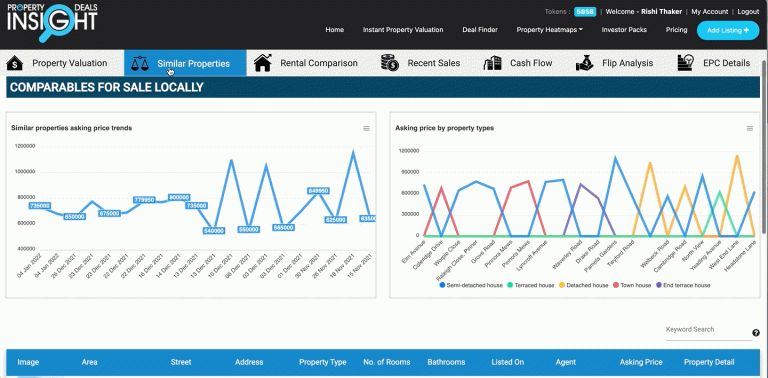
Here you can compare local asking prices of similar properties on the market for sale. It shows the asking price trends for similar properties and the asking price by property types, both in graphical format. It also shows nearby properties and their details, including the asking price in a tabular format below.
Rental Comparison
This compares the rents of other similar properties to give you an indication of the expected rents within the area. It shows the asking rent price trends and the rental trends by property types, both in graphical format. It also shows nearby properties and their details, including rent per month in a tabular format below.
Recent Sales
This gives you trusted public sold prices information combined with our bespoke £sqm pricing. It shows the local properties last sold price against the average per square metre price in a graphical format. It also shows nearby properties and their details, including the last sold price and date in a tabular format below.

Cash Flow
The cash flow report shows you how long it will take to get your money back at various rental points. It shows your costs for the property, including one-off costs, annual costs and net monthly ins/outs. We calculate the gross rental yield and annual cash flow for you and show a 10-year cash flow and cash in deal table. It also shows your cash in deal remaining over 10 years, your purchase costs and the breakdown of the costs in graphical format. With this heading, if you feel our numbers differ from what you have, you can edit our numbers and it will change the insights for you automatically.
Flip Analysis
Our flip analysis report calculates the projected ROI % on any flip investment before committing to a bridging deal. It shows the acquisition, finance/mortgage, project and sale/closing costs. We also show you how much cash should be invested, your gain or loss, the post-refurb valuation, the investment period, the finance cost and the return on investment (ROI). With this heading, if you feel our numbers differ from what you have, you can edit our numbers and it will change the insights for you automatically.
EPC Details
This graph shows the current energy efficiency of the property as well as the potential rating. The potential rating is calculated from the effect of undertaking the recommendations on page.

Within your report, you have the option to share your insights with anyone you like by pressing the share button and copying the link. They won’t have to have an account with us in order to open the shared link and see the report.
However, if you edit the numbers, you will have to send another shared link as the link only shows the report when it had been shared.
You also have the option to download your insights into a PDF report. This comes in a professional PDF that you can download onto your desktop and show your clients or partners.
This PDF can only be used by people who are on the individual gold and premium plans or any business plan. The PDF can also be branded to your business’s details and colours if you purchase the premium business plan. Click here to see our pricing page.
One PDI token will be deducted for each Property Valuation Download. Click here for our pricing page.
